

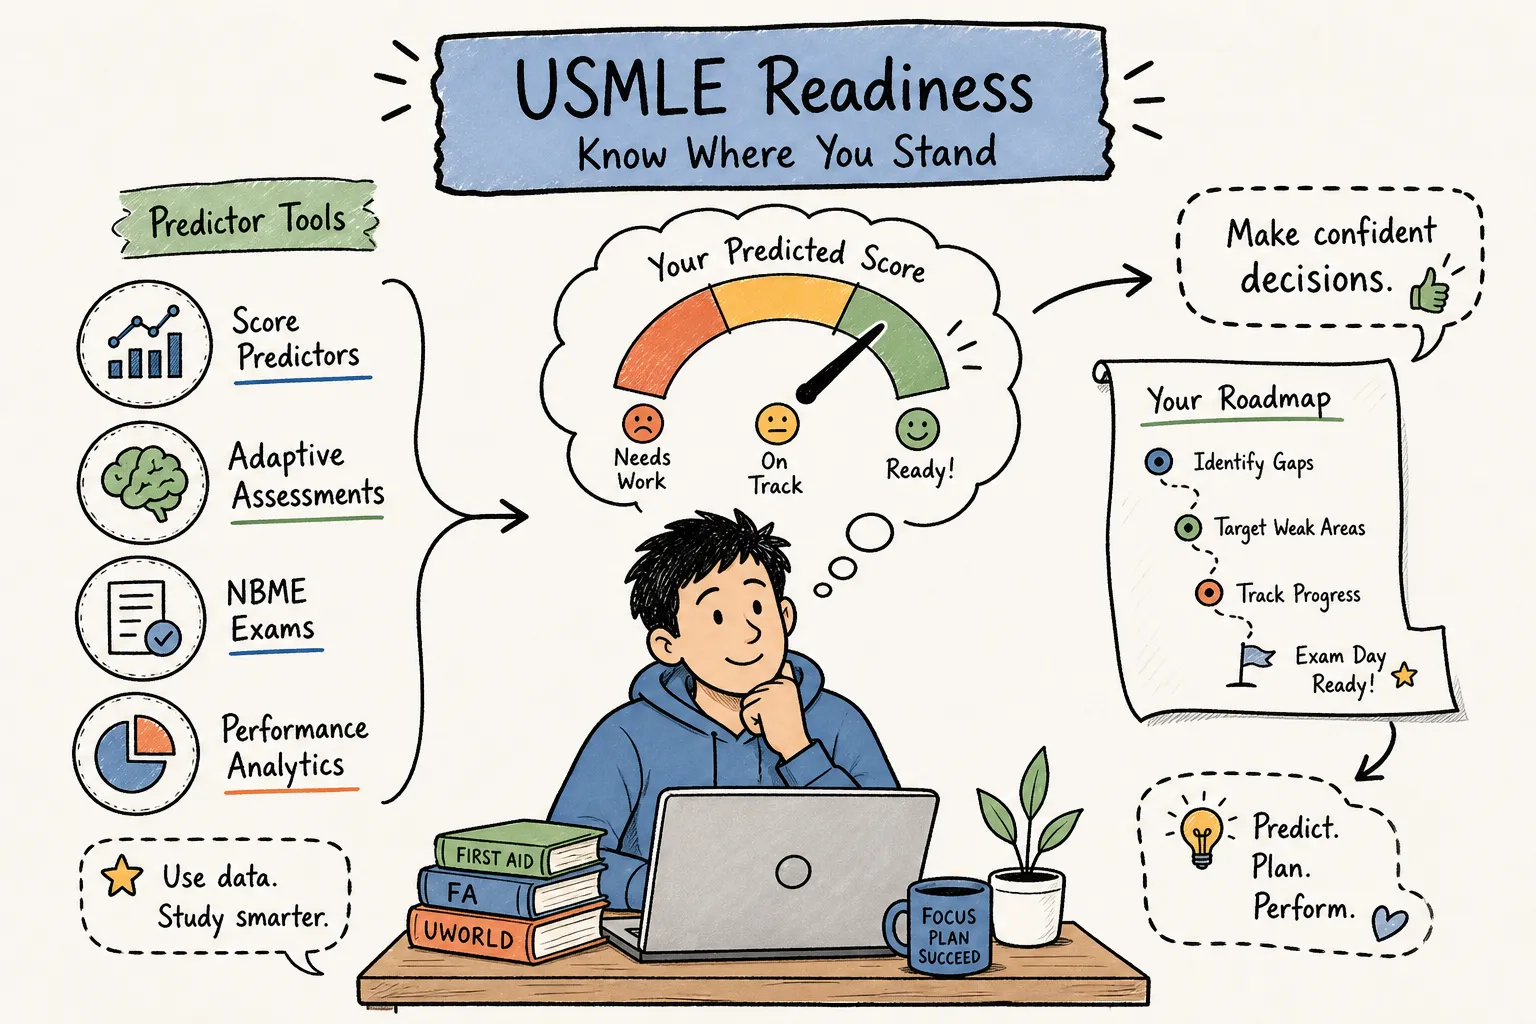
You score a 244 on your UWSA2, walk into test day with genuine confidence, and then get your real result back 10, 15 points lower. That gap is not bad luck, and it is not a fluke. Based on internal observations from working with USMLE candidates at RecallMastery, the same disconnect between predicted scores and actual outcomes shows up in a recognizable pattern, and understanding it starts with knowing what any USMLE predictor can and cannot measure.
A USMLE predictor is a useful compass, but only if you understand what it measures, what it cannot see, and how to act on the number it gives you. Too many students treat a predicted score as a fixed target rather than the center of a range with real uncertainty attached to it. That misreading leads to either false confidence or wasted last-minute effort in the wrong direction.
This guide breaks down the most reliable score estimation tools available in 2026, explains how accurate each one actually is, and shows you how to combine your practice scores into a meaningful forecast. More importantly, it addresses the blind spot that no predictor accounts for, and why that gap may be the real reason students leave points on the table on exam day.
How a USMLE score predictor actually generates your estimate
The inputs and the math behind the estimate
Tools like USMLEPredictor, AMBOSS, and StudyCCS take your practice exam scores as inputs and run them through regression models calibrated against databases of past student reports. USMLEPredictor uses a three-method ensemble combining K-nearest neighbors, weighted averages, and per-form regression, trained on 5,039 verified student score reports collected from 2022 to 2026 (vendor-reported figure).
StudyCCS draws on 1,322 real student reports for its Step 3 predictions and claims predictions within plus or minus 8 points when you provide three or more inputs (vendor-reported). AMBOSS states its predicted range captures the real score 95% of the time for Step 2 CK (vendor-reported). These figures have not been independently validated, so treat them as directionally useful rather than as guarantees. Links to each tool’s methodology page are worth reviewing before you rely on any single output.
Why Step 1 predictions are a different conversation
Step 1 became pass/fail in 2022, which means any tool still generating a three-digit “Step 1 score prediction” is misaligned with how the exam actually reports results. For Step 1, the right question is not “what will I score” but “am I comfortably above the passing threshold.” NBME updated its CBSSA pass-probability guidance in July 2024, and scaled scores in the 62, 68 range map to roughly 92, 97% pass probability. If your CBSSA puts you in that zone or higher, interpret the result as a confidence signal, not a numeric estimate.
What “within 7, 10 points” actually means for you
Correlation coefficients and confidence intervals sound precise, but they do not always translate cleanly to your individual result. A tool can report r=0.92 and still miss your personal score by 8, 12 points because correlation describes how a population of scores move together, not how accurately the model predicts any one student’s result. A “95% confidence interval” framing sounds reassuring until you realize a 10-point range on a 260-point exam spans several percentile points at the competitive end of the score distribution. Treat any predicted score as the center of a roughly 5, 10-point window depending on the tool; apply a conservative buffer if you are uncertain which predictor is better calibrated for your exam step.
Best USMLE predictor tools and their accuracy
NBME forms: still the closest thing to the real exam
Recent NBME forms remain the gold standard for Step 2 CK and Step 3 predictions, and the reason is straightforward: they are produced by the same organization that writes the real exam. In published data, UWSA2 achieved R²=0.680 for Step 1, slightly ahead of NBME CBSSA Form 16 at R²=0.660 in the same dataset. When you average multiple recent NBME forms and weight the most recent one more heavily, predictive accuracy improves further. The mean of your last two NBME forms, weighted 60, 40 toward the most recent, gives you a stronger signal than any single score ever will.
UWSA2 vs. UWSA1: why the second self-assessment wins
UWSA2 consistently outperforms UWSA1 as a standalone predictor for both Step 1 and Step 2 CK, with correlation estimates clustering around r=0.85, 0.89 across several student-reported datasets and score aggregators. The most likely reason is timing: UWSA2 is almost always taken closer to exam day, so it reflects a more current knowledge state rather than an older snapshot. UWSA1 has real value as a mid-preparation calibration tool, but it should never anchor your final readiness estimate. Use UWSA1 to identify gaps; use UWSA2 to forecast your result.
Free 120
The Free 120 serves two purposes: late-stage readiness confirmation and interface familiarity. Its correlation with final scores is weaker than recent NBME forms or UWSA2, so its primary value is as a gut-check, not a primary forecast input.
Why timing your practice exams matters more than which exam you take
The 1, 3 week window that yields the most reliable predictions
A practice score is a snapshot of your skill at that specific moment, so the shorter the gap between assessment and exam date, the less your knowledge state shifts before test day. UWSA2 is most predictive when taken 1, 3 weeks before your exam date. Recent NBME forms are strongest in the 4, 6 week window. Scores taken more than 6 weeks out reflect an older skill state and consistently over- or underestimate actual readiness. On the other end, taking a full practice exam within 5 days of test day can produce artificially depressed scores driven by fatigue rather than genuine ability, which skews your prediction downward at exactly the wrong moment.
How to sequence your last four weeks of practice testing
A practical sequence for the final month looks like this: take an NBME form at 4, 5 weeks out, UWSA1 at 3, 4 weeks, UWSA2 at 1, 2 weeks, and the Free 120 in the final week as a quick interface check. Use the average of your NBME form and UWSA2 as your primary prediction baseline, weighted toward the UWSA2 since it reflects your current state. This sequence gives you both a trend line and a final-state estimate. A rising trend across the sequence is more meaningful than any single data point. A flat or declining trend across the same window is a clear signal to reassess your final-week priorities.
How to combine multiple practice scores into one reliable predicted score
Simple averaging vs. weighted averaging: which to use
If all your practice exams are on the same scale and taken within a 4, 6 week window, the simplest approach is the mean of your last 2, 3 scores. If they span a wider time range, apply a weighted average that gives more importance to the most recent result, since it better reflects your current ability. Step 2 CK tutors commonly use the mean of the last two NBME forms with a 60, 40 weight toward the most recent, a heuristic consistent with the principle that more recent data is more relevant data. The weighting should always reflect that reality.
When to standardize scores before combining them
If you are mixing AMBOSS, UWorld, and NBME scores reported on different scales or formats, standardize each score to a z-score before averaging them. Converting to z-scores means subtracting the mean and dividing by the standard deviation for each assessment type, which puts all scores on the same scale before you combine them. This prevents a single test with a wider numeric range from dominating your composite estimate. Standardizing is the step most students skip, and it explains why some combined estimates feel inconsistent with actual test-day performance.
The gap between your predicted score and your actual score (and how to close it)
What every score predictor is blind to
Predictors are calibrated on historical data from past exams. They measure how well your performance on practice materials correlates with performance on those historical content patterns.
What they cannot account for is how the exam has shifted between when the calibration data was collected and when you actually sit for your test. New clinical vignette styles, newly emphasized disease presentations, and recently updated treatment guidelines do not register in a regression model trained on older student reports. That content drift is not a flaw in the tools; it is a structural limitation of any system built on historical averages.
Turning your predicted score into a study action plan
If your predicted score is on target, use your final two weeks to consolidate what you know rather than expanding into new territory. If you are 10, 15 points below your goal, diagnose whether the gap is conceptual (addressable through targeted Qbank drilling) or content-pattern-driven (recently tested presentations you have not yet encountered).
A consistent divergence between your NBME scores and your UWSA2 may indicate the second problem rather than the first, though this pattern should be treated as a hypothesis to investigate rather than a definitive diagnosis. That distinction still changes what you work on in the final stretch: conceptual gaps respond to targeted Qbank work, while content-pattern gaps respond to direct exposure to what is currently appearing on the exam.
- On target: consolidate and review high-miss areas from your last NBME form
- 10, 15 points below goal: identify whether the gap is conceptual or content-pattern-driven before choosing your next resource
- Consistent NBME vs. UWSA2 divergence: consider prioritizing current exam content patterns over additional Qbank sets
Use your USMLE predictor as a compass, not a destination
The most accurate setup for predicting your Step score is multiple recent NBME forms averaged with UWSA2, taken in the final 3, 4 weeks before your exam. Any number that comes out of that process is the center of a range, not a fixed outcome. Think of it as your best available answer to “predict my Step score” given standardized data, not a guarantee. The tools covered here give you the best forecast available from standardized practice data, and they are genuinely useful for making strategic timing decisions about when to schedule your exam.
What no USMLE predictor can tell you is whether you have seen what the exam is actually asking right now. That exposure gap is real, and it is worth addressing directly in your final preparation phase. Pairing your Qbank work with current recalled content means your preparation reflects today’s exam, not last cycle’s version of it. The predictor tells you where you are; the recalled content helps close the gap between where you are and where the current exam expects you to be.
Use a reliable USMLE predictor as a compass, not a destination, and act on the range it gives you. Assess your trend, time your exam strategically, and make sure your final preparation is calibrated to what is actually being tested in 2026. A predicted score that drives the right action is worth far more than a number you study around rather than toward.
Study from what the exam is actually testing
RecallMastery’s USMLE Step 1 recalls are concept-based, updated monthly through your test date, and delivered as a single file you can open on any device. Also worth a look: free recall samples. If the number still feels ambiguous, one-to-one expert USMLE guidance will read your data with you.